Sodium »
PDB 1t4b-1u8r »
1u8r »
Sodium in PDB 1u8r: Crystal Structure of An Ider-Dna Complex Reveals A Conformational Change in Activated Ider For Base-Specific Interactions
Protein crystallography data
The structure of Crystal Structure of An Ider-Dna Complex Reveals A Conformational Change in Activated Ider For Base-Specific Interactions, PDB code: 1u8r
was solved by
G.Wisedchaisri,
R.K.Holmes,
W.G.J.Hol,
with X-Ray Crystallography technique. A brief refinement statistics is given in the table below:
| Resolution Low / High (Å) | 46.75 / 2.75 |
| Space group | P 31 |
| Cell size a, b, c (Å), α, β, γ (°) | 107.959, 107.959, 215.124, 90.00, 90.00, 120.00 |
| R / Rfree (%) | 23 / 26.5 |
Other elements in 1u8r:
The structure of Crystal Structure of An Ider-Dna Complex Reveals A Conformational Change in Activated Ider For Base-Specific Interactions also contains other interesting chemical elements:
| Cobalt | (Co) | 24 atoms |
Sodium Binding Sites:
The binding sites of Sodium atom in the Crystal Structure of An Ider-Dna Complex Reveals A Conformational Change in Activated Ider For Base-Specific Interactions
(pdb code 1u8r). This binding sites where shown within
5.0 Angstroms radius around Sodium atom.
In total 8 binding sites of Sodium where determined in the Crystal Structure of An Ider-Dna Complex Reveals A Conformational Change in Activated Ider For Base-Specific Interactions, PDB code: 1u8r:
Jump to Sodium binding site number: 1; 2; 3; 4; 5; 6; 7; 8;
In total 8 binding sites of Sodium where determined in the Crystal Structure of An Ider-Dna Complex Reveals A Conformational Change in Activated Ider For Base-Specific Interactions, PDB code: 1u8r:
Jump to Sodium binding site number: 1; 2; 3; 4; 5; 6; 7; 8;
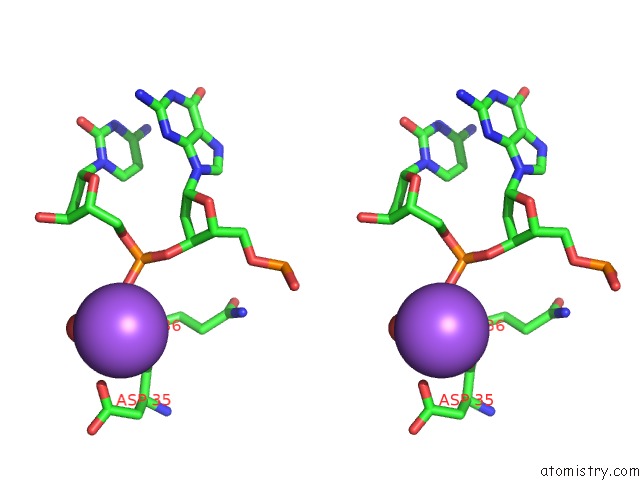
Sodium binding site 1 out of 8 in 1u8r
Go back to
Sodium binding site 1 out
of 8 in the Crystal Structure of An Ider-Dna Complex Reveals A Conformational Change in Activated Ider For Base-Specific Interactions

Mono view

Stereo pair view
Mono view
Stereo pair view
A full contact list of Sodium with other atoms in the Na binding
site number 1 of Crystal Structure of An Ider-Dna Complex Reveals A Conformational Change in Activated Ider For Base-Specific Interactions within 5.0Å range:
|
Sodium binding site 2 out of 8 in 1u8r
Go back to
Sodium binding site 2 out
of 8 in the Crystal Structure of An Ider-Dna Complex Reveals A Conformational Change in Activated Ider For Base-Specific Interactions

Mono view

Stereo pair view
Mono view
Stereo pair view
A full contact list of Sodium with other atoms in the Na binding
site number 2 of Crystal Structure of An Ider-Dna Complex Reveals A Conformational Change in Activated Ider For Base-Specific Interactions within 5.0Å range:
|
Sodium binding site 3 out of 8 in 1u8r
Go back to
Sodium binding site 3 out
of 8 in the Crystal Structure of An Ider-Dna Complex Reveals A Conformational Change in Activated Ider For Base-Specific Interactions

Mono view

Stereo pair view
Mono view
Stereo pair view
A full contact list of Sodium with other atoms in the Na binding
site number 3 of Crystal Structure of An Ider-Dna Complex Reveals A Conformational Change in Activated Ider For Base-Specific Interactions within 5.0Å range:
|
Sodium binding site 4 out of 8 in 1u8r
Go back to
Sodium binding site 4 out
of 8 in the Crystal Structure of An Ider-Dna Complex Reveals A Conformational Change in Activated Ider For Base-Specific Interactions

Mono view
Stereo pair view
Mono view
Stereo pair view
A full contact list of Sodium with other atoms in the Na binding
site number 4 of Crystal Structure of An Ider-Dna Complex Reveals A Conformational Change in Activated Ider For Base-Specific Interactions within 5.0Å range:
|
Sodium binding site 5 out of 8 in 1u8r
Go back to
Sodium binding site 5 out
of 8 in the Crystal Structure of An Ider-Dna Complex Reveals A Conformational Change in Activated Ider For Base-Specific Interactions

Mono view

Stereo pair view
Mono view
Stereo pair view
A full contact list of Sodium with other atoms in the Na binding
site number 5 of Crystal Structure of An Ider-Dna Complex Reveals A Conformational Change in Activated Ider For Base-Specific Interactions within 5.0Å range:
|
Sodium binding site 6 out of 8 in 1u8r
Go back to
Sodium binding site 6 out
of 8 in the Crystal Structure of An Ider-Dna Complex Reveals A Conformational Change in Activated Ider For Base-Specific Interactions

Mono view

Stereo pair view
Mono view
Stereo pair view
A full contact list of Sodium with other atoms in the Na binding
site number 6 of Crystal Structure of An Ider-Dna Complex Reveals A Conformational Change in Activated Ider For Base-Specific Interactions within 5.0Å range:
|
Sodium binding site 7 out of 8 in 1u8r
Go back to
Sodium binding site 7 out
of 8 in the Crystal Structure of An Ider-Dna Complex Reveals A Conformational Change in Activated Ider For Base-Specific Interactions

Mono view

Stereo pair view
Mono view
Stereo pair view
A full contact list of Sodium with other atoms in the Na binding
site number 7 of Crystal Structure of An Ider-Dna Complex Reveals A Conformational Change in Activated Ider For Base-Specific Interactions within 5.0Å range:
|
Sodium binding site 8 out of 8 in 1u8r
Go back to
Sodium binding site 8 out
of 8 in the Crystal Structure of An Ider-Dna Complex Reveals A Conformational Change in Activated Ider For Base-Specific Interactions

Mono view

Stereo pair view
Mono view
Stereo pair view
A full contact list of Sodium with other atoms in the Na binding
site number 8 of Crystal Structure of An Ider-Dna Complex Reveals A Conformational Change in Activated Ider For Base-Specific Interactions within 5.0Å range:
|
Reference:
G.Wisedchaisri,
R.K.Holmes,
W.G.J.Hol.
Crystal Structure of An Ider-Dna Complex Reveals A Conformational Change in Activated Ider For Base-Specific Interactions. J.Mol.Biol. V. 342 1155 2004.
ISSN: ISSN 0022-2836
PubMed: 15351642
DOI: 10.1016/J.JMB.2004.07.083
Page generated: Sun Oct 6 22:43:10 2024
ISSN: ISSN 0022-2836
PubMed: 15351642
DOI: 10.1016/J.JMB.2004.07.083
Last articles
Ca in 5PANCa in 5PAM
Ca in 5PAK
Ca in 5PAJ
Ca in 5PAI
Ca in 5PAG
Ca in 5PAF
Ca in 5P2P
Ca in 5PAC
Ca in 5PAE